. The Eastern Bering Sea Shelf : oceanography and resources / edited by Donald W. Hood and John A. Calder. Oceanography Bering Sea.. Walleye pollock 533 TABLE 33-3 Indices of age-class abundance measured by NMFS Crab-Groundfish research vessel surveys within a central area of the eastern Bering Sea during June to mid-August, 1973-78 (units = 10^ individuals per 159,100 km^).^ Survey Number of Number of Age-classes (yr) year trawls otoliths 1 2 3 4 5 6 7 8 9 10 11 12 13 14 15 1973 111 490 756.9 518.2 146.0 193.4 99.4 34.4 91.5 117.8 18.9 17.9 4.51 0.401 0.072 - 1974 111 954 2840.6 850.3 287.9 5
Image details
Contributor:
The Book Worm / Alamy Stock PhotoImage ID:
RE599RFile size:
7.1 MB (160.1 KB Compressed download)Releases:
Model - no | Property - noDo I need a release?Dimensions:
1262 x 1979 px | 21.4 x 33.5 cm | 8.4 x 13.2 inches | 150dpiMore information:
This image is a public domain image, which means either that copyright has expired in the image or the copyright holder has waived their copyright. Alamy charges you a fee for access to the high resolution copy of the image.
This image could have imperfections as it’s either historical or reportage.
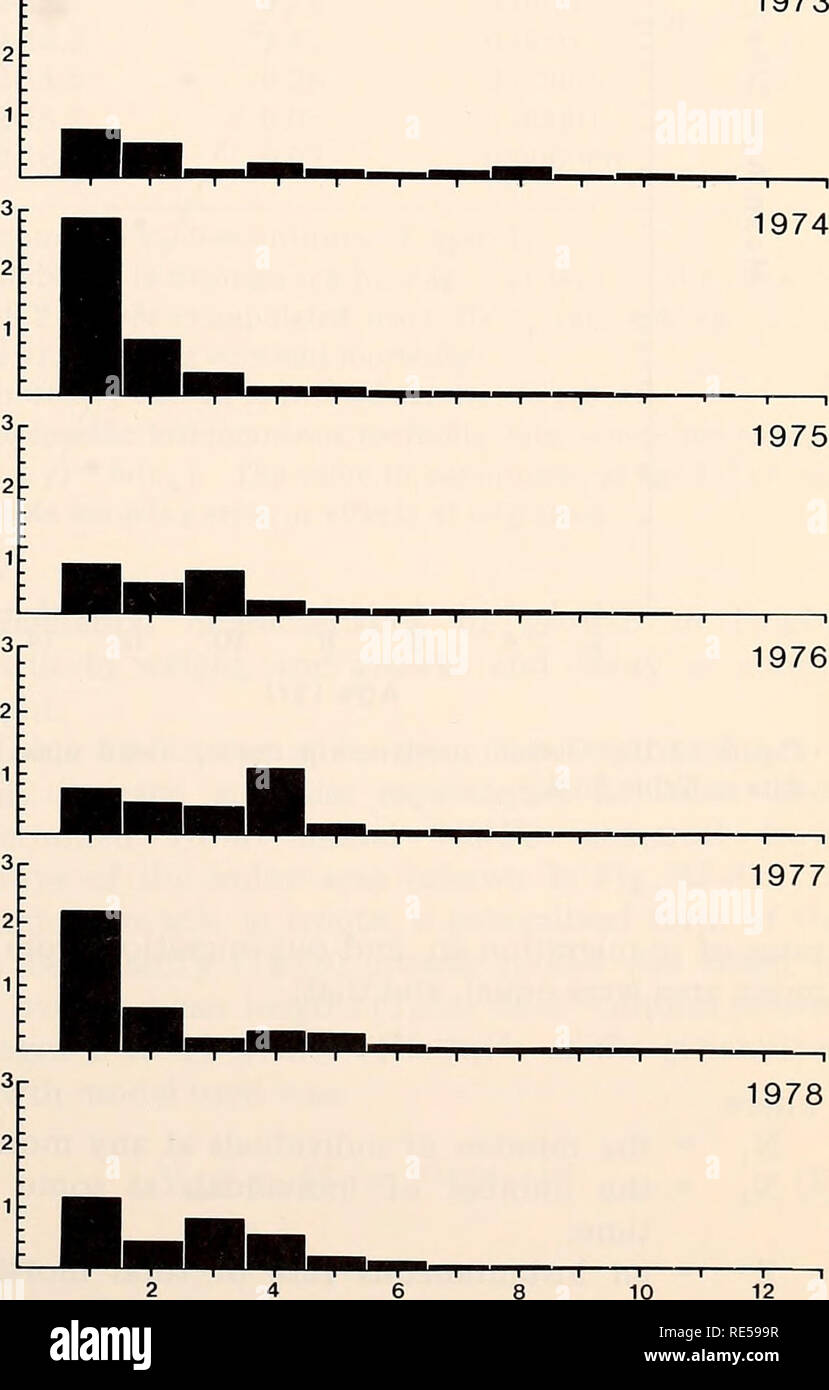
. The Eastern Bering Sea Shelf : oceanography and resources / edited by Donald W. Hood and John A. Calder. Oceanography Bering Sea.. Walleye pollock 533 TABLE 33-3 Indices of age-class abundance measured by NMFS Crab-Groundfish research vessel surveys within a central area of the eastern Bering Sea during June to mid-August, 1973-78 (units = 10^ individuals per 159, 100 km^).^ Survey Number of Number of Age-classes (yr) year trawls otoliths 1 2 3 4 5 6 7 8 9 10 11 12 13 14 15 1973 111 490 756.9 518.2 146.0 193.4 99.4 34.4 91.5 117.8 18.9 17.9 4.51 0.401 0.072 - 1974 111 954 2840.6 850.3 287.9 56.1 67.7 38.0 39.1 29.0 29.5 5.12 3.00 0.176 0.190 — — 1975 111 766 758.4 402.4 614.2 108.0 24.6 27.5 14.7 14.2 7.98 5.99 0.52 0.594 0.009 — — 1976 107 1990 729.0 500.4 479.7 1014.1 132.5 35.0 38.8 46.2 41.0 22.3 8.28 1.850 0.607 0.032 0.171 1977 112 944 2241.9 630.2 145.8 245.3 231.9 72.0 29.8 23.7 23.6 13.1 11.9 3.200 0.491 0.180 -- 1978 116 1256 1170.9 400.4 806.9 507.0 139.5 92.3 29.1 24.2 29.1 19.0 6.26 5.100 — — — OveraU mean (1973-78) 1416.3 550.3 413.4 354.0 115.9 49.9 40.5 42.5 25.0 13.9 5.75 1.82 0.280 0.050 0.030 Standard deviation (1973-78) 906.7 169.9 267.7 359.4 71.0 26.0 26.5 38.4 11.2 7.11 4.02 2.01 0.260 0.070 0.070 Coefficient of variation (1973-78) 0.64 0.31 0.65 1.02 0.61 0.52 0.65 0.90 0.45 0.51 0.70 1.10 0.93 1.40 2.33 * Based upon estimates of nominal sampling effort, uncorrected for differences in effective fishing power. Italicized values were apparently affected by in- or out-migrations. 3r 1973 Size and age composition Rather than being a homogeneous pool, the eastern Bering Sea pollock population exhibits a size and age structure that reflects pulsed annual birth inputs, birth and survival rates, and a differentiation of distributional patterns based upon age. Pollock are generally considered to spawn during only one period each year. In the eastern Bering Sea, the spawning period has been reported to extend from the end of February thr