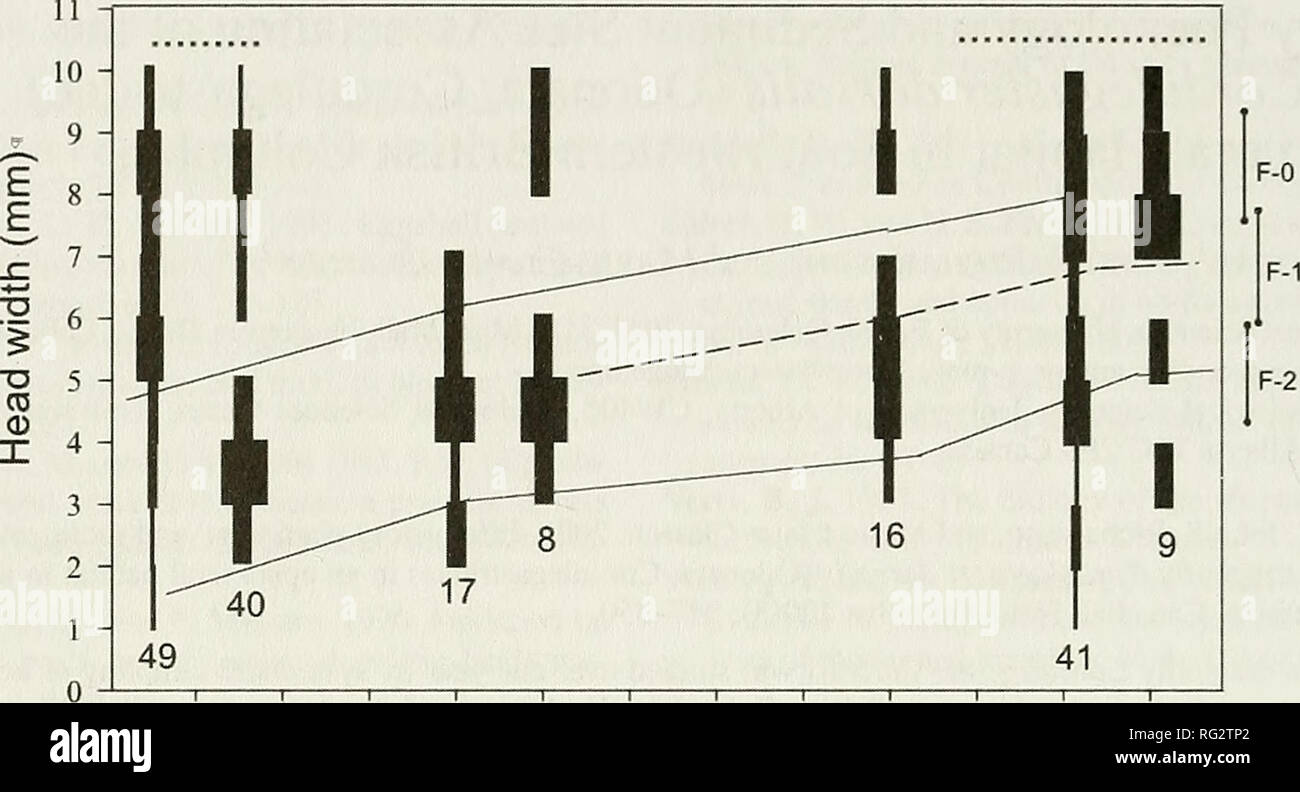
. The Canadian field-naturalist. Natural history; Sciences naturelles. 348 The Canadian Field-Naturalist Vol. 120. Aug Sep Oct Nov Dec Jan Feb Mar Apr May Jun Jul ^1 100% Figure 1. Life history patterns of Cordiilegaster dorsalis shown for 2002-2003 — in G Creek (« = 175). Continuous lines ascending from left to right indicate inferred boundaries between successive hatching cohorts. The emergence period during late summer is shown (dotted line). Size ranges of the last three instars are indicated. The broken line indicates an alternate interpretation and represents the inferred boundary betwee
Image details
Contributor:
Book Worm / Alamy Stock PhotoImage ID:
RG2TP2File size:
7.1 MB (217.5 KB Compressed download)Releases:
Model - no | Property - noDo I need a release?Dimensions:
2149 x 1162 px | 36.4 x 19.7 cm | 14.3 x 7.7 inches | 150dpiMore information:
This image is a public domain image, which means either that copyright has expired in the image or the copyright holder has waived their copyright. Alamy charges you a fee for access to the high resolution copy of the image.
This image could have imperfections as it’s either historical or reportage.
. The Canadian field-naturalist. Natural history; Sciences naturelles. 348 The Canadian Field-Naturalist Vol. 120. Aug Sep Oct Nov Dec Jan Feb Mar Apr May Jun Jul ^1 100% Figure 1. Life history patterns of Cordiilegaster dorsalis shown for 2002-2003 — in G Creek (« = 175). Continuous lines ascending from left to right indicate inferred boundaries between successive hatching cohorts. The emergence period during late summer is shown (dotted line). Size ranges of the last three instars are indicated. The broken line indicates an alternate interpretation and represents the inferred boundary between the two components that could result from cohort-splitting in the two-year-old hatching cohort, thus distinguishing larvae that grow fast (above line) and slowly (below line). Numbers below columns indicate sample sizes for each sampling date. Widths of black bars for each interval of headwidth on a given date represent the relative fraction of the total sample that fell in that interval; total possible width for any given sampling date is represented by the black legend box labelled 100%. Methods Study Site This study took place in the 5157 ha Malcolm Knapp Research Forest, located in Maple Ridge, British Columbia. The forest is located in the Pacific coastal rain forest, with a maritime climate of cool dry summers and warm wet winters (Naiman et al. 2000). We sampled Cordulegaster dorsalis larvae for life history characteristics and sediment associations in three streams within the forest (I, F and G streams; 49°18'40"N, 122°32'40"W), which were part of an on- going riparian management experiment (see Kiffney et al. (2003) for site descriptions). Both F and G streams retained a 10 m forest buffer while I stream flowed through a 5-year-old clearcut. The dominant vegetation surrounding these creeks included Red Alder {Alnus rubra) and Vine Maple {Acer circinatum) with a canopy composed largely of Western Hemlock (Tsuga hetero- phylla). Western Redcedar {Thuja p