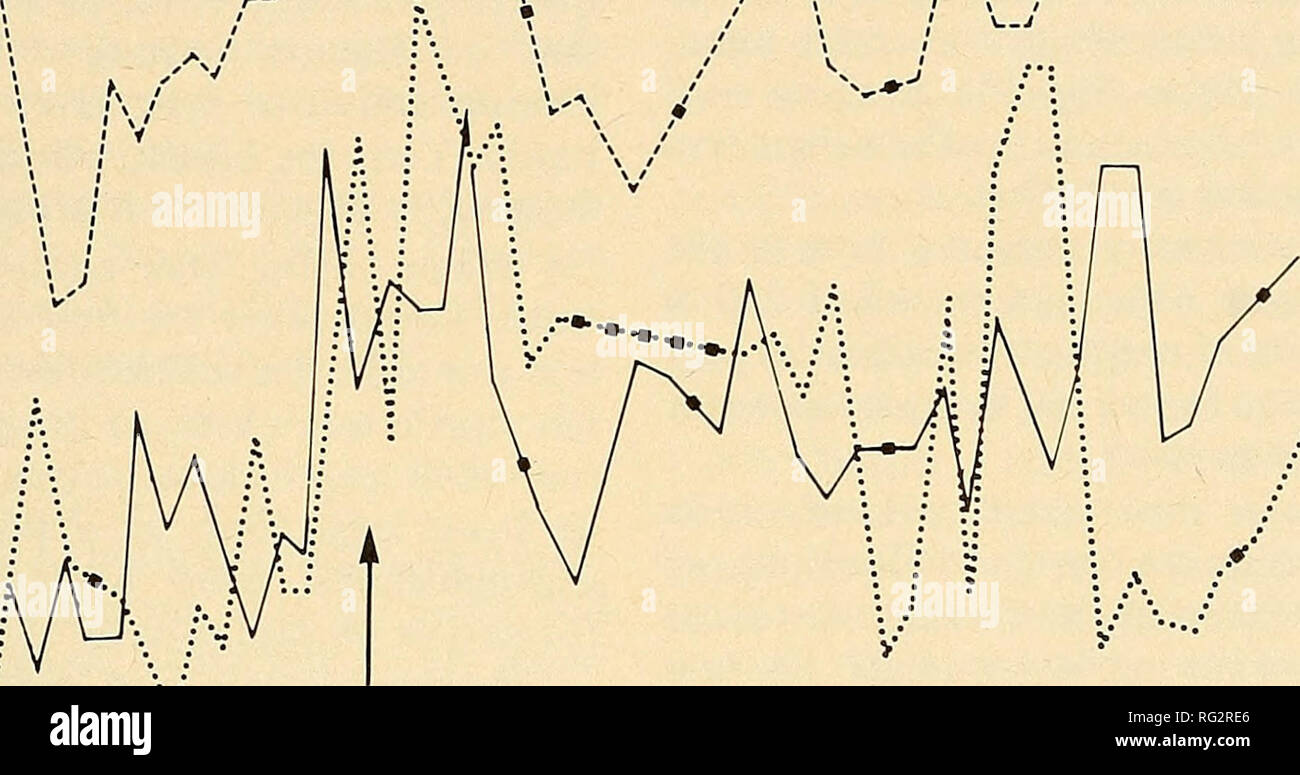
. The Canadian field-naturalist. 1977 Whillans and Crossman: Midland Painted Turtle, Central Ontario 53 30-f U ^ 25+ Z) >- / '.. â 3.0 ^ z â¢2.5"- CO UJ I ^â 2.0 i tâ U- +1.5° 5 +1.0 => z -0.5 22 25 30 1 â M AY âº- 10 15 20 25 J UNE 1 5 10 â â¦"« J ULY â DATE 1974 Figure 5. Daily maximum and minimum air temperatures plotted with the numbers of turtles caught per net, calculated per 24-h period in 1974. direct relationship between air temperature and turtle movement reflected in the number cap- tured. But, there often was a time lag between peaks of temperature and activity. T
Image details
Contributor:
Book Worm / Alamy Stock PhotoImage ID:
RG2RE6File size:
7.1 MB (259.1 KB Compressed download)Releases:
Model - no | Property - noDo I need a release?Dimensions:
2176 x 1148 px | 36.8 x 19.4 cm | 14.5 x 7.7 inches | 150dpiMore information:
This image is a public domain image, which means either that copyright has expired in the image or the copyright holder has waived their copyright. Alamy charges you a fee for access to the high resolution copy of the image.
This image could have imperfections as it’s either historical or reportage.
. The Canadian field-naturalist. 1977 Whillans and Crossman: Midland Painted Turtle, Central Ontario 53 30-f U ^ 25+ Z) >- / '.. â 3.0 ^ z â¢2.5"- CO UJ I ^â 2.0 i tâ U- +1.5° 5 +1.0 => z -0.5 22 25 30 1 â M AY âº- 10 15 20 25 J UNE 1 5 10 â â¦"« J ULY â DATE 1974 Figure 5. Daily maximum and minimum air temperatures plotted with the numbers of turtles caught per net, calculated per 24-h period in 1974. direct relationship between air temperature and turtle movement reflected in the number cap- tured. But, there often was a time lag between peaks of temperature and activity. There was also a coincidental increase in temperature and movement immediately prior to the initiation of nesting activities. Extensive cloud cover was observed (no data) to have a negative influence on turtle activity. Turtles were first seen nesting on 6 June in 1974 and 12 June in 1975. At the initiation of nesting in 1974 approximately 515 Corn Heat Units (CHU) had accumulated since mid-April (calculated from records at a climatological station 19.3 air km to the northwest). Nesting in 1975 started when 804 CHU had been recorded. In the aquatic netting of 1974, 174 different C. p. marginata were captured, measured, and returned to exactly where caught, before plastral numbering became illegible. Of these, 43 (24.7%) were recaptured, 32 (18.3%) only once, seven (4.0%) twice, two (1.1%) thrice, one 8 times, and one 10 times, for a total of 244 captures. Twenty- six of the 43 recaptured turtles had changed position between captures. In the total of 244 aquatic captures between 22 May and 11 July 1974 there were 159 males and 85 females; the sex ratio was 1.87:1. Because some turtles were captured more than once, actually only 174 individual C. p. marginata were caught in the nets. This included 104 males and 70 females for a sex ratio of 1.49:1. Single captures were recorded for 131 turtles with a 1.34:1 sex ratio. This contrasts sharply with the sex ratio of 2.