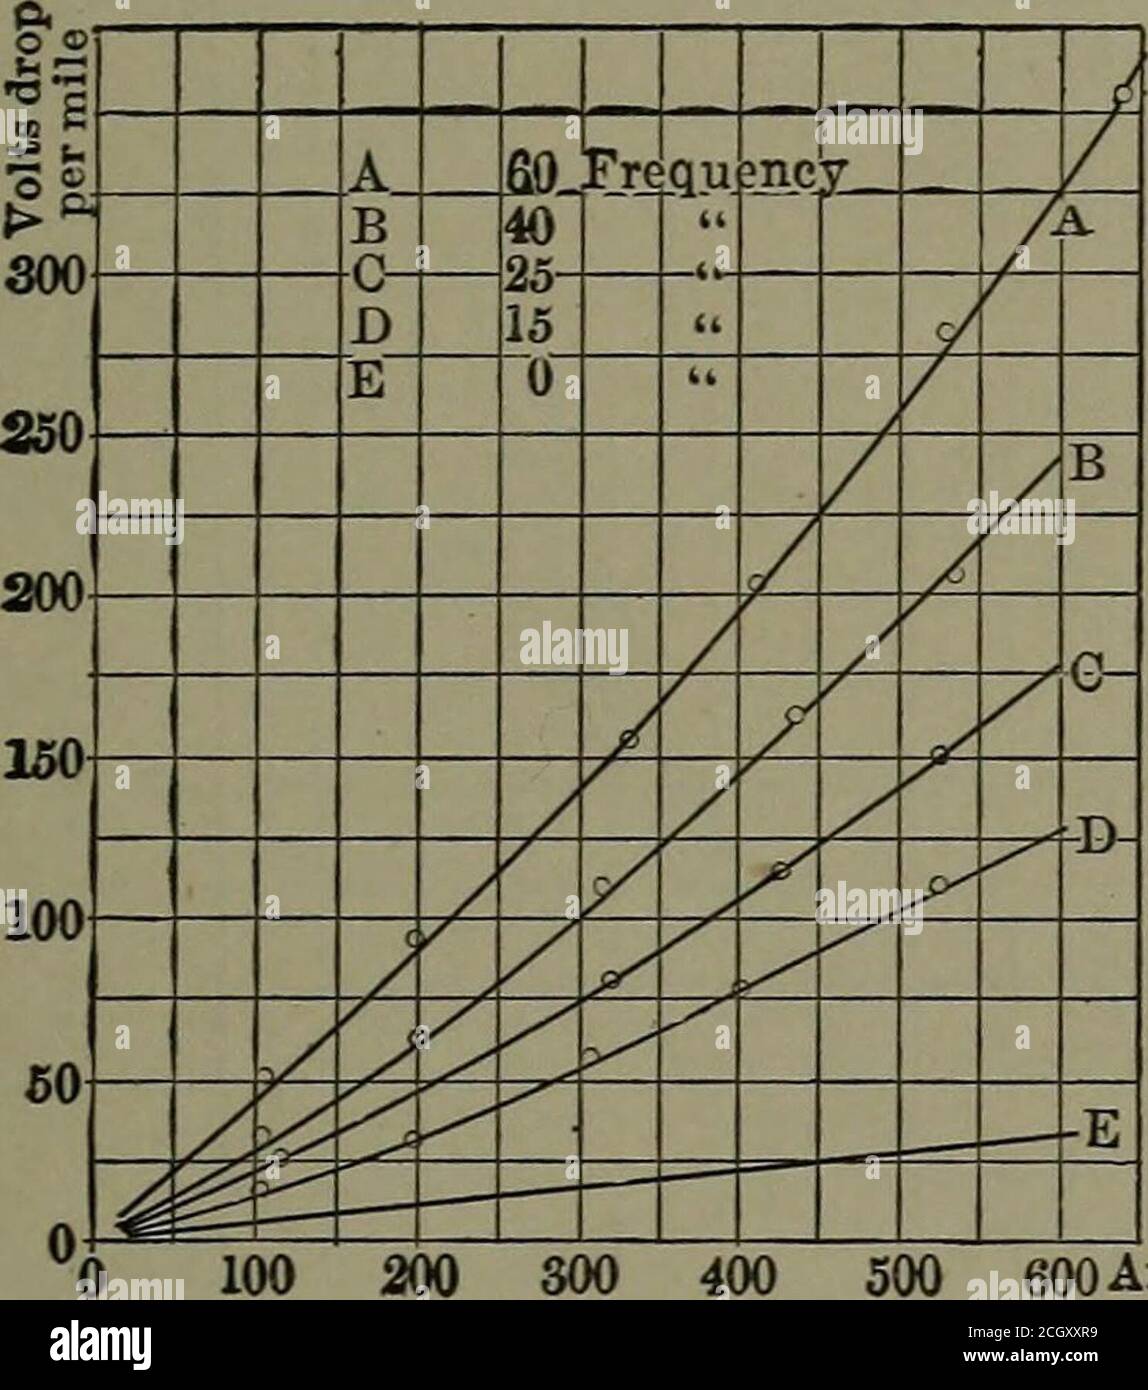
. Report of the Electric Railway Test Commission to the president of the Louisiana Purchase Exposition . riation of power-factor; the data for each frequency beingplotted in a single curve. Test No. 47. Double Track Alone.—The data calcu-lated from the results of the investigations on the double trackalone, are shown graphically in Figs. 142, 143, 144, and 145.These curves have been plotted in the same general manner aswere those of Figs. 138, 139, 140, and 141. In all cases the cur-rent values have been taken as abscissas. Fig. 142 shows thepressure drop per mile of track for various currents
Image details
Contributor:
Reading Room 2020 / Alamy Stock PhotoImage ID:
2CGXXR9File size:
7.2 MB (284.7 KB Compressed download)Releases:
Model - no | Property - noDo I need a release?Dimensions:
1486 x 1682 px | 25.2 x 28.5 cm | 9.9 x 11.2 inches | 150dpiMore information:
This image is a public domain image, which means either that copyright has expired in the image or the copyright holder has waived their copyright. Alamy charges you a fee for access to the high resolution copy of the image.
This image could have imperfections as it’s either historical or reportage.
. Report of the Electric Railway Test Commission to the president of the Louisiana Purchase Exposition . riation of power-factor; the data for each frequency beingplotted in a single curve. Test No. 47. Double Track Alone.—The data calcu-lated from the results of the investigations on the double trackalone, are shown graphically in Figs. 142, 143, 144, and 145.These curves have been plotted in the same general manner aswere those of Figs. 138, 139, 140, and 141. In all cases the cur-rent values have been taken as abscissas. Fig. 142 shows thepressure drop per mile of track for various currents at givenfrequencies. Fig. 143 shows the power losses per mile. Fig. 144shows the ratio of A.C. to D.C. pressure drop, and Fig. 145 showsthe power factor. ALTERNATING CURRENT LOSSES IN TRACK 447 Test No. 48. Single Track and Single Trolley.—Thedata representing the investigations on a single track and singletrolley are shovm graphically in Figs. 146, 147, 148, and 149.These curves have been constructed in the same general manneras that employed in the construction of the curves of Figs. 138, ^ o. ^5.70, 000 ~ ~ A A 60 Freo UP icy / 60, 000 B *5 / /p % 15 u / / 50, 000 E u / i. 40, 000 n ■ /i ) 30, 000 k V // /1 / 20, 000 A y / / Va / / F, 10, 000 ) w ^ yk^ ^y ^ f 0 .^ ^ r^ -^■ 600 Amperes 0 100 200 300 400 dOO 600 Amperes Fig. 150. — Variation of Pressure Drop perMile with Total Amperes. Single Tracf<Alone. Fig. 151. — Variation of Pressure Lost per Mileof Track with Total Current. Single TracliAlone.