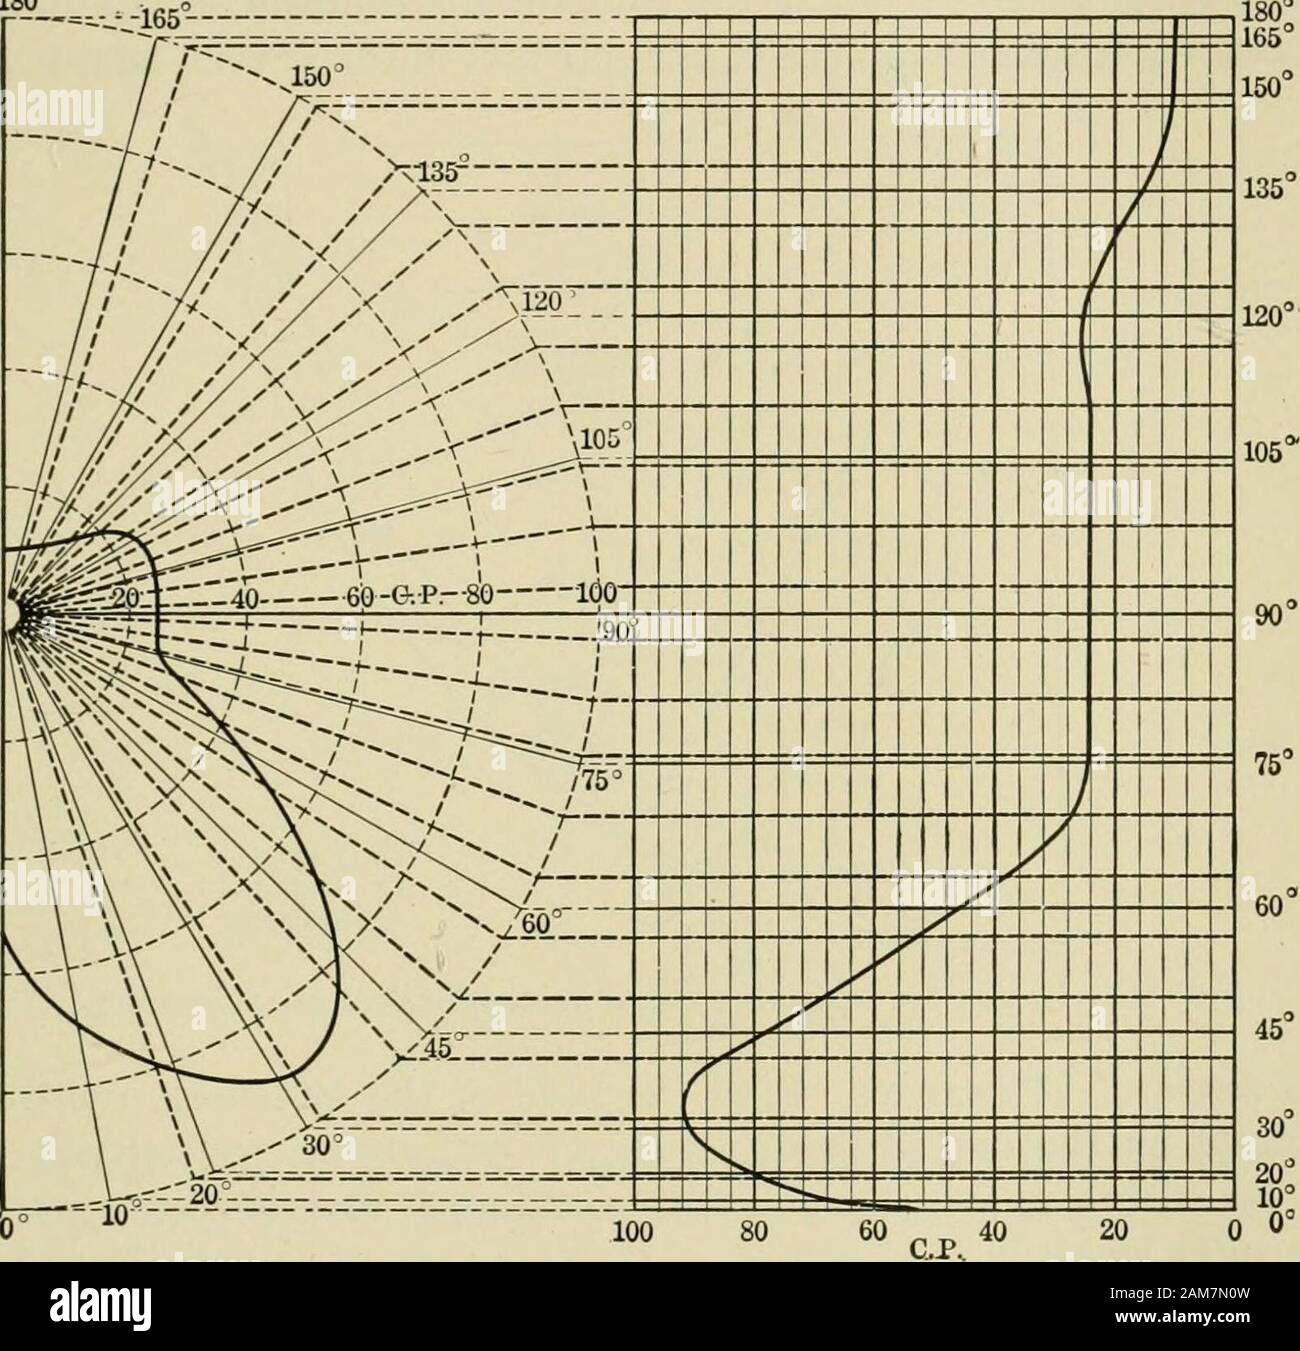
Light, photometry and illumination : a thoroughly revedof ''Electrical illuminating engineering'' . d d are equal. Since these areas representgraphically to scale the value of the light flux we have the samevalue of the lumens or mean spherical candle-power for each. Macbeths Polar Flux Paper.—In the method of determiningmean spherical intensities just discussed it will be seen that thespherical area surrounding the source of light was divided intozones of equal areas and the candle-power in the direction of thezonal centers of these areas assumed as the average for that LIGHT-FLUX CALCULATION
Image details
Contributor:
The Reading Room / Alamy Stock PhotoImage ID:
2AM7N0WFile size:
7.1 MB (394 KB Compressed download)Releases:
Model - no | Property - noDo I need a release?Dimensions:
1604 x 1557 px | 27.2 x 26.4 cm | 10.7 x 10.4 inches | 150dpiMore information:
This image is a public domain image, which means either that copyright has expired in the image or the copyright holder has waived their copyright. Alamy charges you a fee for access to the high resolution copy of the image.
This image could have imperfections as it’s either historical or reportage.
Light, photometry and illumination : a thoroughly revedof ''Electrical illuminating engineering'' . d d are equal. Since these areas representgraphically to scale the value of the light flux we have the samevalue of the lumens or mean spherical candle-power for each. Macbeths Polar Flux Paper.—In the method of determiningmean spherical intensities just discussed it will be seen that thespherical area surrounding the source of light was divided intozones of equal areas and the candle-power in the direction of thezonal centers of these areas assumed as the average for that LIGHT-FLUX CALCULATIONS 151 zone. This method forms the basis of Macbeths polar fluxpaper, which is the ordinary polar coordinate paper on whichare placed the radial lines representing the zonal centers of 20zones of equal areas. The construction of this paper is shownin Fig. 87. The vertical distribution curves may be plotted asusual. The values of the candle-power read along these addi-tional lines shown dotted in the figure, and the sum of thesereadings divided by the number of readings will give approxi- 180°. Fig. 87.—Construction of Macbeths polar flux paper. mately the average candle-power throughout the zones whichthey represent. In order to use this method on polar curvesconstructed on ordinary polar coordinate paper, these radiallines may be drawn as in Fig. 88, ^ on transparent celluloid ofconvenient size, to place over the polar curves. The values ofcandle-power may be read and the results determined as on thepolar flux diagram. Ilium. Eng., N. Y., Vol. 3, p. 27, Mar., 1908. 152 LIGHT, PHOTOMETRY AND ILLUMINATION The Kennelly Diagram.—The Kennelly diagram* possesses theadvantage of yielding the vahie of the mean spherical intensityin terms of a linear quantity. Moreover, only an angle protractorand a pair of compasses are necessary for its construction. Thismethod consists in determining graphically an evolute from thepolar curve of the luminous source, together with its involutean