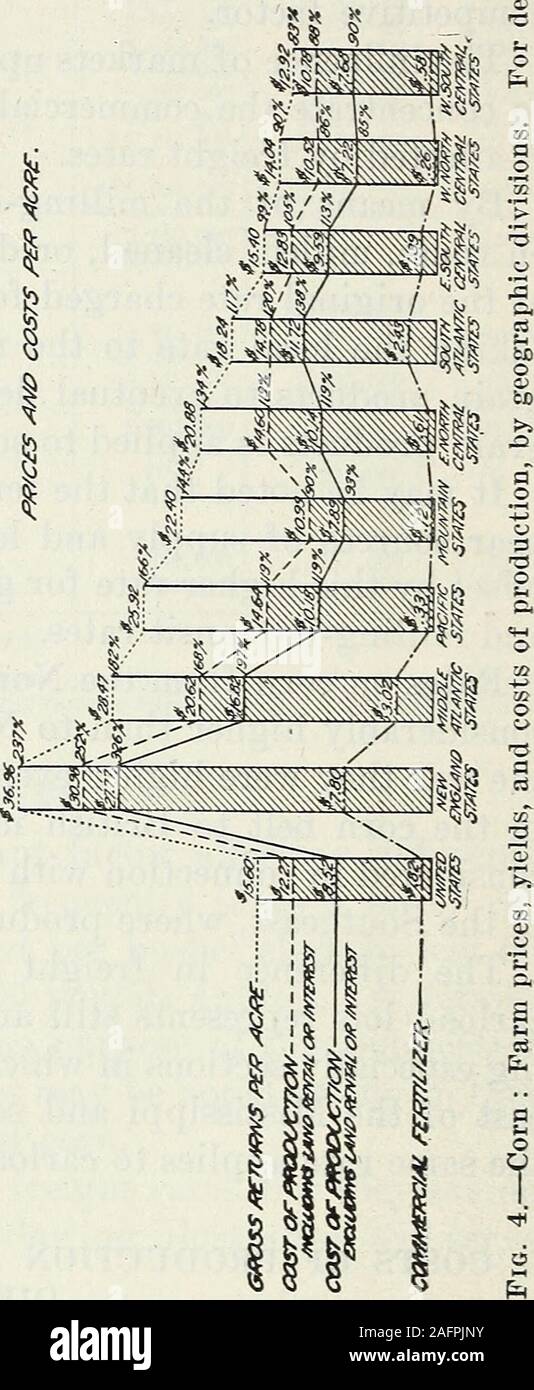
. Geographical phases of farm prices : corn. In the upper illustration on figure -i prices and costs per bushel aregiven, and in the lower the data are upon an acreage basis. The New England States stand out prominently with highestprices per bushel and highest production per acre. But these areoffset by maximum costs of production (in which high values of com-mercial fertilizer enter), with a resulting low ratio of money returns. GEOGRAPHICAL PHASES OF FARM PRICES: CORN. 27 The favorable combination of high price per bushel and lowest costper acre obtains in the Southern States, but average y
Image details
Contributor:
The Reading Room / Alamy Stock PhotoImage ID:
2AFPJNYFile size:
7.1 MB (355.7 KB Compressed download)Releases:
Model - no | Property - noDo I need a release?Dimensions:
1014 x 2464 px | 17.2 x 41.7 cm | 6.8 x 16.4 inches | 150dpiMore information:
This image is a public domain image, which means either that copyright has expired in the image or the copyright holder has waived their copyright. Alamy charges you a fee for access to the high resolution copy of the image.
This image could have imperfections as it’s either historical or reportage.
. Geographical phases of farm prices : corn. In the upper illustration on figure -i prices and costs per bushel aregiven, and in the lower the data are upon an acreage basis. The New England States stand out prominently with highestprices per bushel and highest production per acre. But these areoffset by maximum costs of production (in which high values of com-mercial fertilizer enter), with a resulting low ratio of money returns. GEOGRAPHICAL PHASES OF FARM PRICES: CORN. 27 The favorable combination of high price per bushel and lowest costper acre obtains in the Southern States, but average yields are solow as to make the cost per bushel very high, with resulting mini-mum net returns. Highest net returns are indicated for the Moun-tain and Pacific States. Here, however, a relatively lower percent-age of merchantable corn must be taken into consideration. Details follow in Tables 5 and 5A. Relationships can best be ob-served in the percentages, based upon the United States as 100 percent. By way of example: Iowa farm price per b