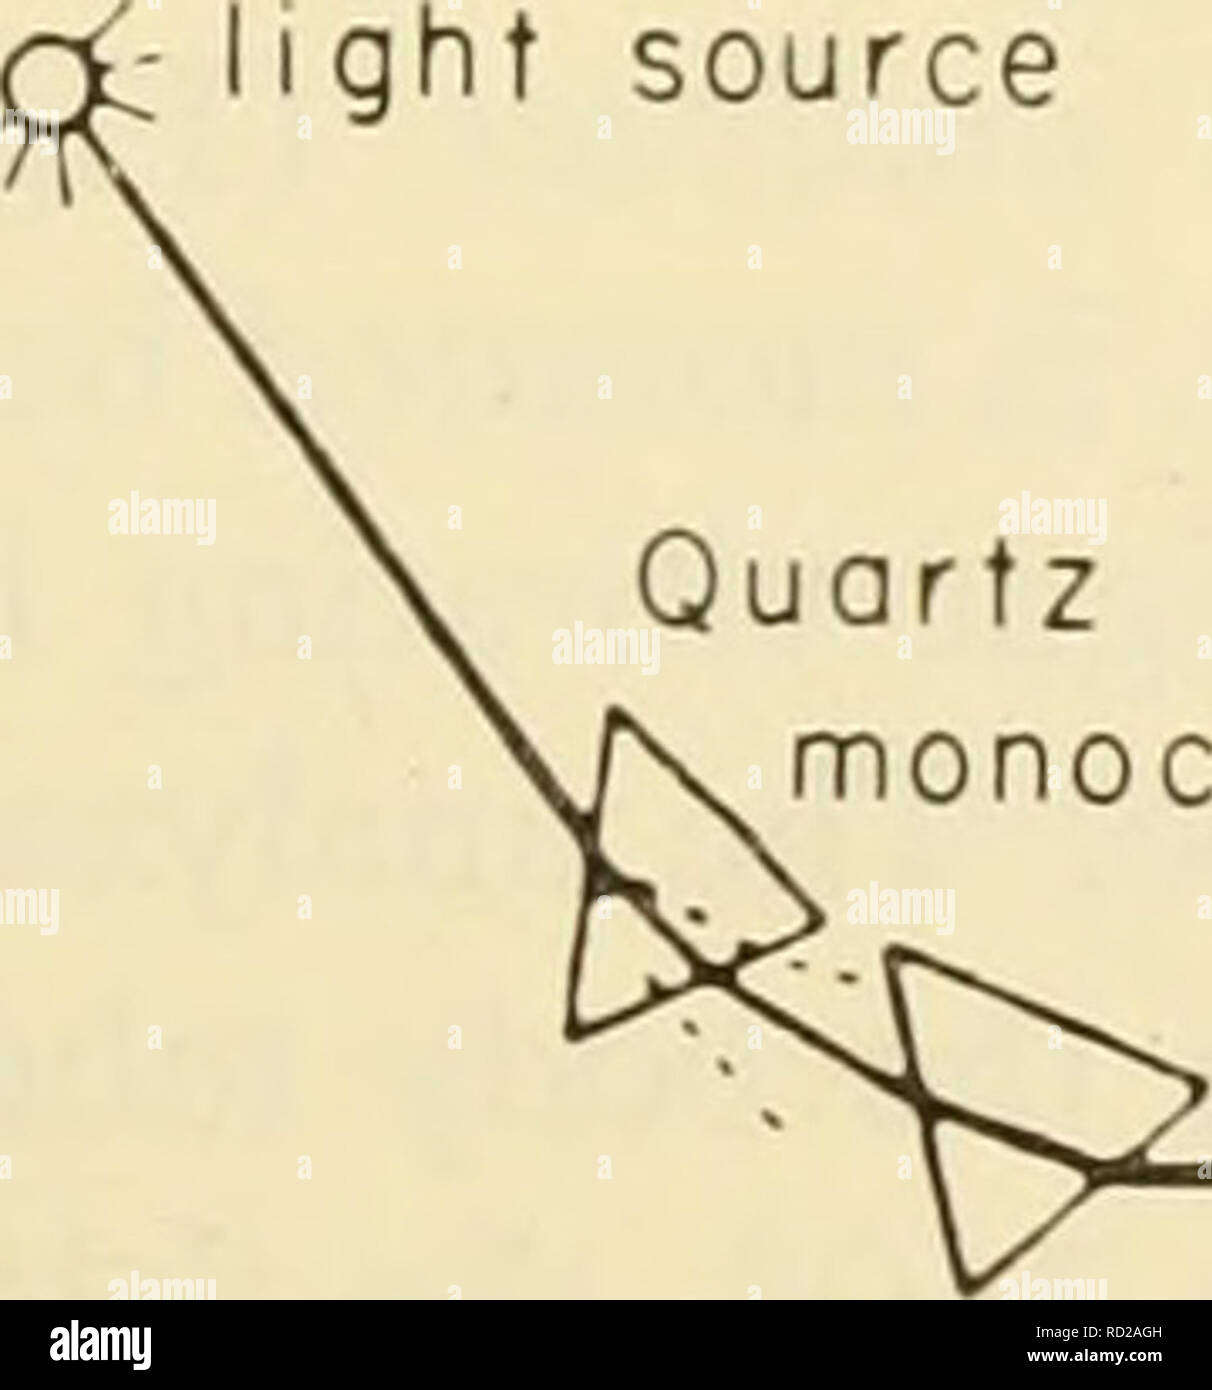
. Cytology. Cytology. The ultraviolet microscope can be adapted for use as a spectropho- tometer to measure changes in the absorption of nucleic acids and proteins in cell structures. This method has been used to study metabolic changes during cell division, growth, and differentiation (Figure 11-20). i Photoelectric cell image Amplifier I A Galvanometer ( o i ,' Quartz ocular >-- Ultraviolet ligtit source. 4) Quartz monochromotor central > Quartz objective iQuartz slide and cover strip Quartz condenser beam /^ Quartz ^ reflector Figure 11-21. Schematic Diagram Showing Light Source, Mon
Image details
Contributor:
The Book Worm / Alamy Stock PhotoImage ID:
RD2AGHFile size:
7.2 MB (119.7 KB Compressed download)Releases:
Model - no | Property - noDo I need a release?Dimensions:
1527 x 1637 px | 25.9 x 27.7 cm | 10.2 x 10.9 inches | 150dpiMore information:
This image is a public domain image, which means either that copyright has expired in the image or the copyright holder has waived their copyright. Alamy charges you a fee for access to the high resolution copy of the image.
This image could have imperfections as it’s either historical or reportage.
. Cytology. Cytology. The ultraviolet microscope can be adapted for use as a spectropho- tometer to measure changes in the absorption of nucleic acids and proteins in cell structures. This method has been used to study metabolic changes during cell division, growth, and differentiation (Figure 11-20). i Photoelectric cell image Amplifier I A Galvanometer ( o i , ' Quartz ocular >-- Ultraviolet ligtit source. 4) Quartz monochromotor central > Quartz objective iQuartz slide and cover strip Quartz condenser beam /^ Quartz ^ reflector Figure 11-21. Schematic Diagram Showing Light Source, Monochro- mator. Microscope, and Photoelectric Apparatus for Measuring the Absorp- tion of Ultraviolet Light by Cell Structures. (From Gersh, I. and Bodian, D., 1943. "Some Chemical Mechanisms in Chromatolysis, " /. Cell. Comp. Physiol, 21, Fig. 1, p. 257.) When operated in this manner, the specific absorption of the substance under study is usually recorded by a photoelectric cell mounted above the body tube of the microscope (Figure 11-21). Briefly, the method involves splitting a monochromatic beam of ultraviolet light into two beams, one of which falls directly on a photoelectric cell (the "blank") SURVEY OF CYTOLOGICAL TECHNIQUES / 241. Please note that these images are extracted from scanned page images that may have been digitally enhanced for readability - coloration and appearance of these illustrations may not perfectly resemble the original work.. Wilson, G. B. (George Bernard), 1914-; Morrison, John H. (John Herbert), 1927-. New York, Reinhold