. Bulletin. Natural history; Natural history. NOV, 1973 T JAN, I MAY MAR, JUL, 1974 SEPT, I JAN, I MAY | SEPT, | JAN, | MAY | SEPT, NOV, MAR, JUL, NOV, MAR. JUL, 1975 1976 Fig. 4.—Average bottom temperatures in the discharge and the intake and control arms of Lake Sangchris from 1973 through 1976 and in Otter Lake during 1975 and 1976. •=STATIONS 5., 4, 3 (discharge ARM ) • •= STATIONS 1, , 1 (INTAKE AND CONTROL ARMs) 15-1 10 5 "1 1 1 1 1 1—'— 1 SEPT, I JAN, I MAY | SEPT, | JAN, | MAY | SEPT, | JAN, | MAY | SEPT. NOV, MAR, JUL, NOV, MAR. JUL, NOV, MAR, JUL.. 1973 1974 1975 1975 Fig. 5
Image details
Contributor:
Library Book Collection / Alamy Stock PhotoImage ID:
RGWC46File size:
7.2 MB (145.8 KB Compressed download)Releases:
Model - no | Property - noDo I need a release?Dimensions:
3851 x 649 px | 32.6 x 5.5 cm | 12.8 x 2.2 inches | 300dpiMore information:
This image is a public domain image, which means either that copyright has expired in the image or the copyright holder has waived their copyright. Alamy charges you a fee for access to the high resolution copy of the image.
This image could have imperfections as it’s either historical or reportage.
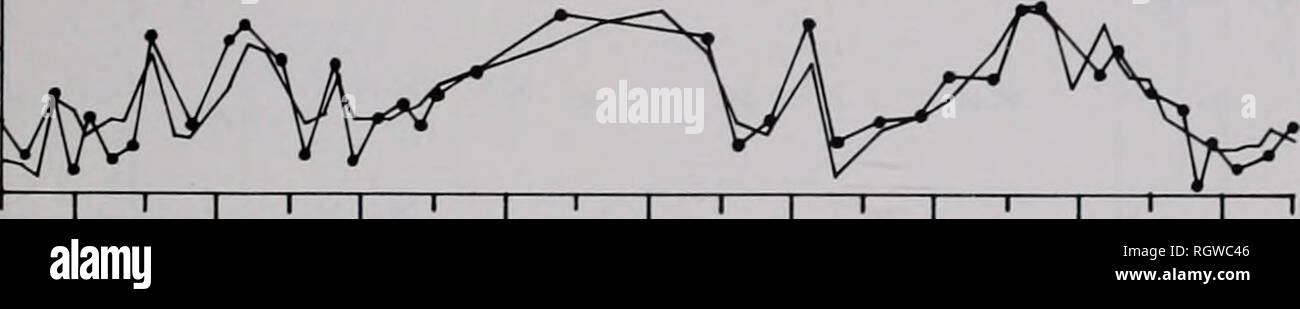
. Bulletin. Natural history; Natural history. NOV, 1973 T JAN, I MAY MAR, JUL, 1974 SEPT, I JAN, I MAY | SEPT, | JAN, | MAY | SEPT, NOV, MAR, JUL, NOV, MAR. JUL, 1975 1976 Fig. 4.—Average bottom temperatures in the discharge and the intake and control arms of Lake Sangchris from 1973 through 1976 and in Otter Lake during 1975 and 1976. •=STATIONS 5., 4, 3 (discharge ARM ) • •= STATIONS 1, , 1 (INTAKE AND CONTROL ARMs) 15-1 10 5 "1 1 1 1 1 1—'— 1 SEPT, I JAN, I MAY | SEPT, | JAN, | MAY | SEPT, | JAN, | MAY | SEPT. NOV, MAR, JUL, NOV, MAR. JUL, NOV, MAR, JUL.. 1973 1974 1975 1975 Fig. 5.—Average oxygen concentrations in the discharge and the intake and control arms of Lake Sangchris from 1973 through 1976. the high turbulence as the heated effluent was expelled from the power plant. Oxygen concentrations in Otter Lake for , 1975 (April through November) and 1976 (April through September) ranged from 3.4 to 9.6 mg/1 at a depth of 8 m, which was comparable to those at Station 2 in the unhealed area of Lake Sangchris. TAXA COLLECTED Twenty-three taxa of oligochaetes, decapods, mollusks, and insects were collected in Lake Sangchris (Table 1). The phantom midge (Chaoborus punctipennis) represented 59 percent of all organisms collected, and the nonbiting midges (Chironomidae) 39 percent. Within the Chironomidae, six species (Chironomus attenuatus, Cryptochironomus fulvus, Coelotanypus conctnnus, Glyptotendipes lobiferus, Procladius bellus, Xenochironomus festivus) of the 15 collected represented 94 percent of the chironomids collected. Other benthic macroinvertebrates, such as mayflies, caddisflies, and oligochaetes, represented only 2 percent of the organisms collected. Benthic macroinvertebrates (Table 1) in the headwaters of the East and West. Please note that these images are extracted from scanned page images that may have been digitally enhanced for readability - coloration and appearance of these illustrations may not perfectly resemble the orig