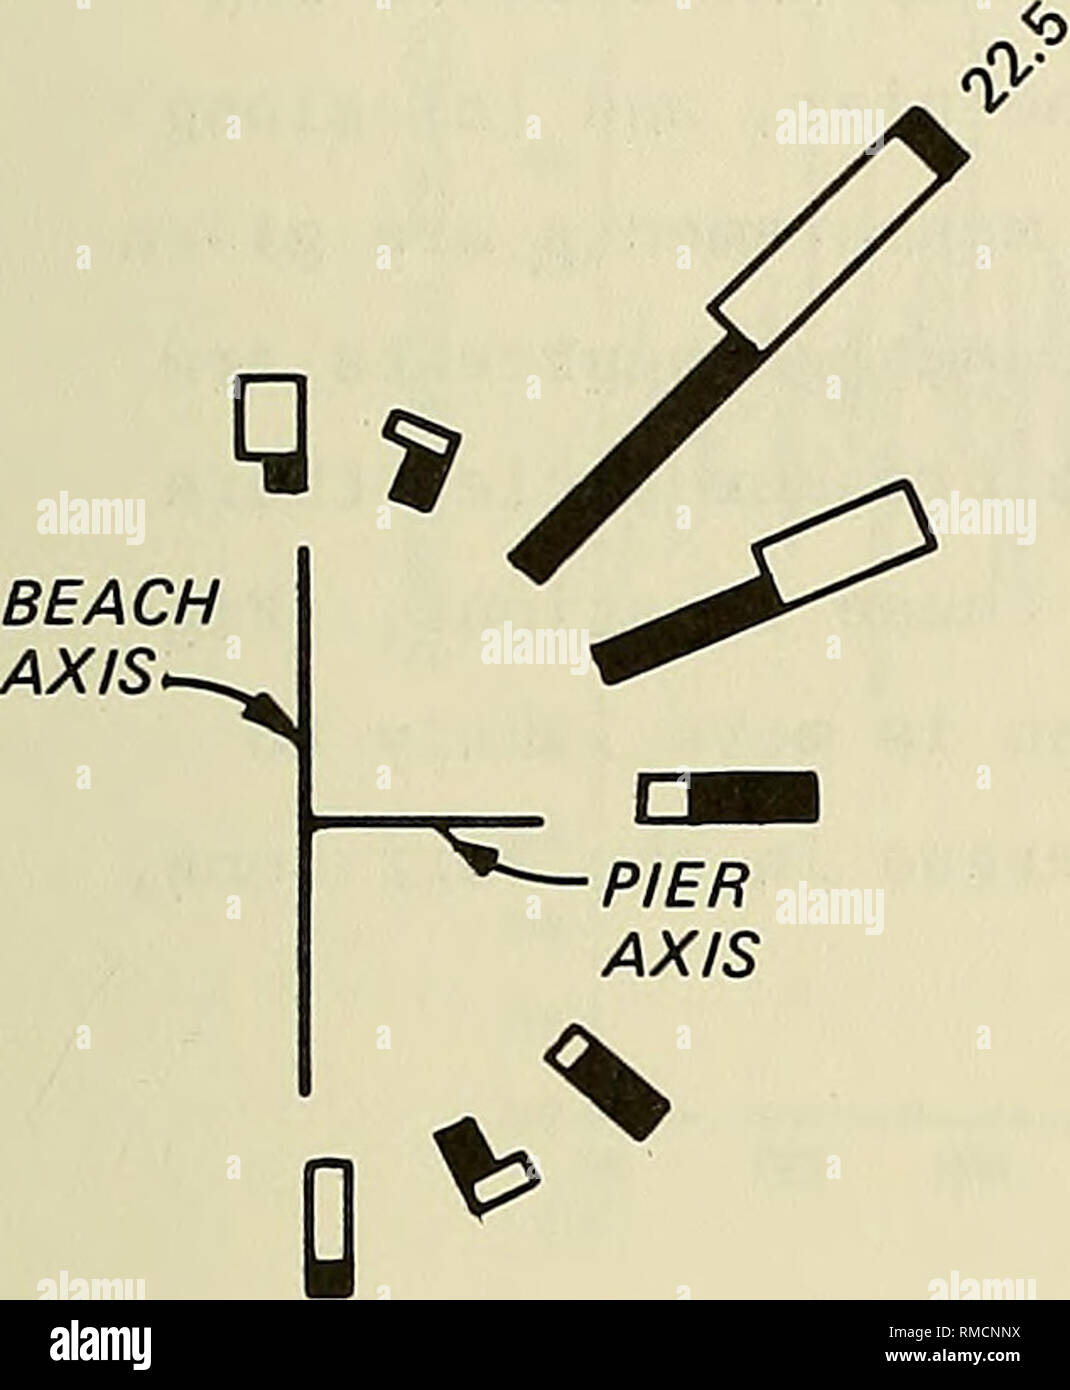
. Annual data summary for 1981 CERC Field Research Facility. Ocean waves; Marine meteorology. /. ^^?^ 67.5 BEACH AXIS-- I Q -PIER AXIS t,^^ 67.5 90 O WIND ROSE SEP 1981 WAVE ROSE SEP 1981 SPEED, m/s in oo CN + r 1 o CN CO CO CM *" *" ^^^ J ^^^H ^^^H 0 5 10 15 20 25 30 35 40 FREQUENCY, % HEIGHT, (m) 0.0 1.0 2.0 3.0 4.0 0 10 20 30 40 50 FREQUENCY, % Figure 22. September 1981 wind and wave directional distributions 49. Please note that these images are extracted from scanned page images that may have been digitally enhanced for readability - coloration and appearance of these illust
Image details
Contributor:
Library Book Collection / Alamy Stock PhotoImage ID:
RMCNNXFile size:
7.1 MB (156.3 KB Compressed download)Releases:
Model - no | Property - noDo I need a release?Dimensions:
1434 x 1742 px | 24.3 x 29.5 cm | 9.6 x 11.6 inches | 150dpiMore information:
This image is a public domain image, which means either that copyright has expired in the image or the copyright holder has waived their copyright. Alamy charges you a fee for access to the high resolution copy of the image.
This image could have imperfections as it’s either historical or reportage.
. Annual data summary for 1981 CERC Field Research Facility. Ocean waves; Marine meteorology. /. ^^?^ 67.5 BEACH AXIS-- I _ Q -PIER AXIS t, ^^ 67.5 90 O WIND ROSE SEP 1981 WAVE ROSE SEP 1981 SPEED, m/s in oo CN + r 1 o CN CO CO CM *" *" ^^^ J ^^^H ^^^H 0 5 10 15 20 25 30 35 40 FREQUENCY, % HEIGHT, (m) 0.0 1.0 2.0 3.0 4.0 0 10 20 30 40 50 FREQUENCY, % Figure 22. September 1981 wind and wave directional distributions 49. Please note that these images are extracted from scanned page images that may have been digitally enhanced for readability - coloration and appearance of these illustrations may not perfectly resemble the original work.. Miller, H. Carl; U. S. Army Engineer Waterways Experiment Station; United States. Army. Corps of Engineers. Vicksburg, Miss. : Dept. of the Army, Waterways Experiment Station, Corps of Engineers ; [Springfield, Va. : Available from National Technical Information Service]