. The Biological bulletin. Biology; Zoology; Biology; Marine Biology. NITROGEN CONTENT AND DISTRIBUTION IN EGGS 455 within 2 per cent of the theoretical value or the experimental analyses just preceding were discarded. The control values ranged between 101.8 per cent and 98.1 per cent but 99.8 per cent and 100.8 per cent were the values more often found. These values correspond to burette readings of 69 and 70 mm.:; while the extremes used were 68 and 71. The 2 per cent accuracy is all that is necessary since individual variation may be as much as 20 per cent between diapause eggs from differe
Image details
Contributor:
Library Book Collection / Alamy Stock PhotoImage ID:
RHP1TDFile size:
7.1 MB (85.8 KB Compressed download)Releases:
Model - no | Property - noDo I need a release?Dimensions:
1349 x 1851 px | 22.8 x 31.3 cm | 9 x 12.3 inches | 150dpiMore information:
This image is a public domain image, which means either that copyright has expired in the image or the copyright holder has waived their copyright. Alamy charges you a fee for access to the high resolution copy of the image.
This image could have imperfections as it’s either historical or reportage.
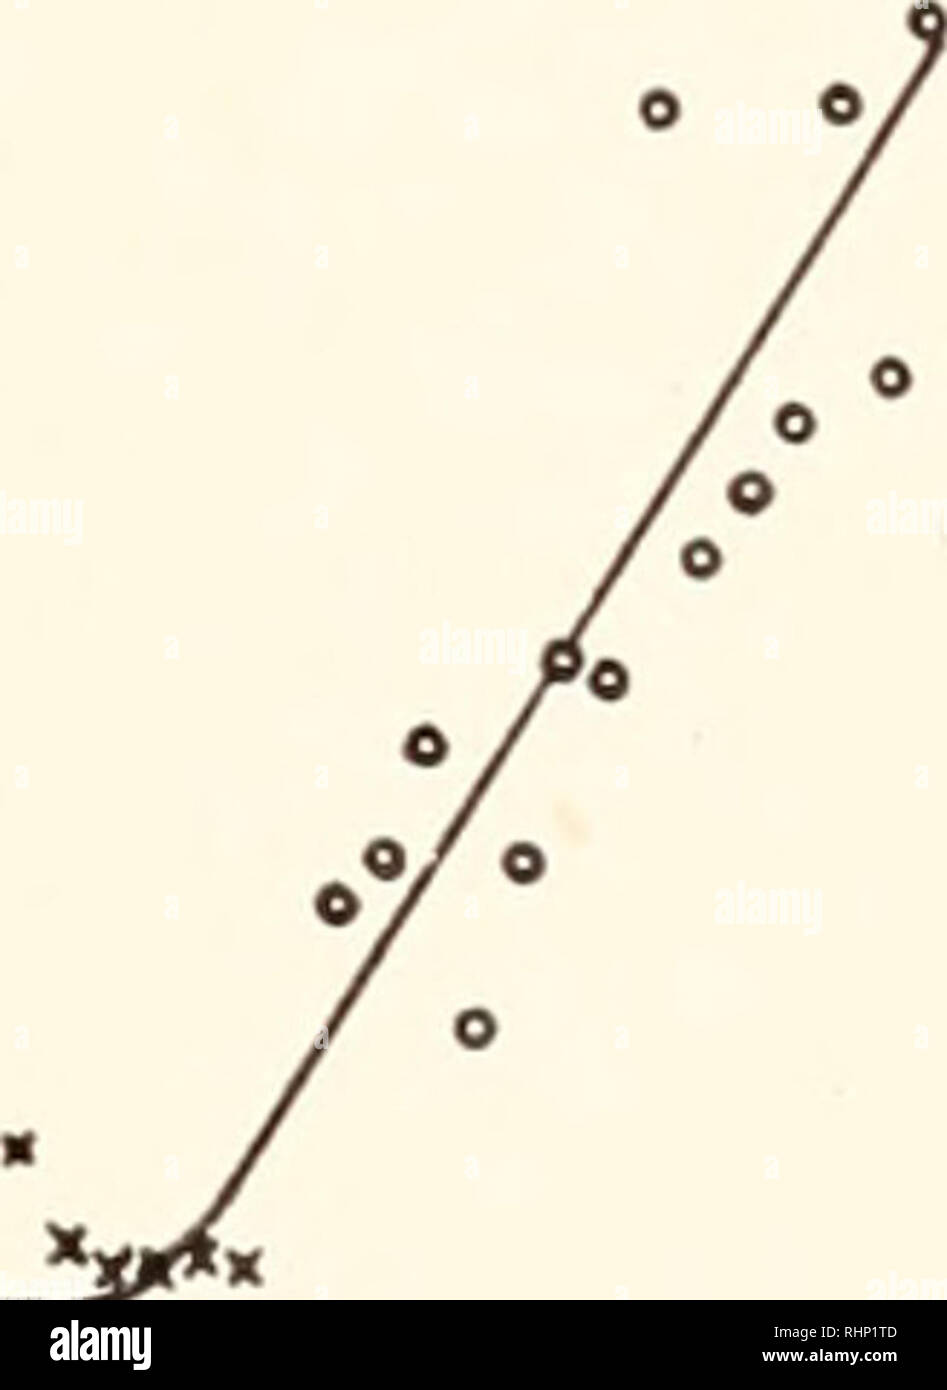
. The Biological bulletin. Biology; Zoology; Biology; Marine Biology. NITROGEN CONTENT AND DISTRIBUTION IN EGGS 455 within 2 per cent of the theoretical value or the experimental analyses just preceding were discarded. The control values ranged between 101.8 per cent and 98.1 per cent but 99.8 per cent and 100.8 per cent were the values more often found. These values correspond to burette readings of 69 and 70 mm.:; while the extremes used were 68 and 71. The 2 per cent accuracy is all that is necessary since individual variation may be as much as 20 per cent between diapause eggs from different pods. RESULTS Macrodeterminations were used to establish the value for the total nitrogen of the intact diapause egg. The eggs are quite variable and therefore a wide range of nitrogen values even for eggs from the same pod exists. The variation is even greater when different pods are used. For this reason, it was thought advisable to use the results of the macro- o te ID o o °8 .06 .04 .02. 20 FIG. 3. 10 20 O 10 DAYS OF DEVELOPMENT Embryo nitrogen. Symbols as in the preceding graphs. analyses to determine the statistical average. The value assigned (174y) for the diapause is the average of 18 determinations of 50 eggs each. This serves as a check on the other curves made from micro- determinations on fewer pods. It will be seen from the yolk curve (Fig. 1) that a wide variation in the yolk nitrogen accounts for most of the variation of the egg as a whole. This can be seen by comparing the individual points on the graph of the yolk (Fig. 1) with those on the curve plotted by adding together the 3 parts of the egg (Fig. 4). In spite of the rather wide variation, a definite trend downward may be seen. The yolk nitrogen drops from about 80 per cent of the total nitrogen at laying to about 60 per cent at diapause. During diapause it remains constant and when development is resumed it decreases rapidly from llOy at diapause to 50 y at hatching.. Please note that these images are