···
Graphic charts. Statistic bars and circle diagrams for data presentation. Comparison histogram elements. Isolated colorful analytic graphs. Business i Image details More information:
Graphic charts. Statistic bars and circle diagrams for data presentation. Comparison histogram elements. Isolated colorful analytic graphs. Business information visualization. Vector infographics set
Search stock photos by tags
Similar stock vectors Infographic isometric vector elements. 3d pie graph, charts and progress bars. Graph and diagram statistic and progress isometric graphic illustration Stock Vector https://www.alamy.com/licenses-and-pricing/?v=1 https://www.alamy.com/infographic-isometric-vector-elements-3d-pie-graph-charts-and-progress-bars-graph-and-diagram-statistic-and-progress-isometric-graphic-illustration-image344751116.html RF 2B0TNFT – Infographic isometric vector elements. 3d pie graph, charts and progress bars. Graph and diagram statistic and progress isometric graphic illustration Vector modern elements for infographics. Horizontal and verticals bars, circle shapes, charts. Chart and circle graph, graphic diagram web illustratio Stock Vector https://www.alamy.com/licenses-and-pricing/?v=1 https://www.alamy.com/vector-modern-elements-for-infographics-horizontal-and-verticals-bars-circle-shapes-charts-chart-and-circle-graph-graphic-diagram-web-illustratio-image354750864.html RF 2BH489M – Vector modern elements for infographics. Horizontal and verticals bars, circle shapes, charts. Chart and circle graph, graphic diagram web illustratio Different graphs. Columns, pie charts, graphs of revenue growth, information bars. Modern flat style. Vector illustration for business, infographic, c Stock Vector https://www.alamy.com/licenses-and-pricing/?v=1 https://www.alamy.com/different-graphs-columns-pie-charts-graphs-of-revenue-growth-information-bars-modern-flat-style-vector-illustration-for-business-infographic-c-image224267090.html RF R0T6XX – Different graphs. Columns, pie charts, graphs of revenue growth, information bars. Modern flat style. Vector illustration for business, infographic, c Histogram Simple vector icon. Illustration symbol design template for web mobile UI element. Stock Vector https://www.alamy.com/licenses-and-pricing/?v=1 https://www.alamy.com/histogram-simple-vector-icon-illustration-symbol-design-template-for-web-mobile-ui-element-image459560367.html RF 2HKJNX7 – Histogram Simple vector icon. Illustration symbol design template for web mobile UI element. Histogram Simple vector icon. Stock Vector https://www.alamy.com/licenses-and-pricing/?v=1 https://www.alamy.com/histogram-simple-vector-icon-image459713794.html RF 2HKWNHP – Histogram Simple vector icon. Isometric infographic. 3D diagrams, graphs, progress bars and charts, business and finance statistic and analytic. Vector presentation layout with Stock Vector https://www.alamy.com/licenses-and-pricing/?v=1 https://www.alamy.com/isometric-infographic-3d-diagrams-graphs-progress-bars-and-charts-business-and-finance-statistic-and-analytic-vector-presentation-layout-with-image472095320.html RF 2JC1PB4 – Isometric infographic. 3D diagrams, graphs, progress bars and charts, business and finance statistic and analytic. Vector presentation layout with Charts, bars and graphs icons sketches for business or infographic theme design. Vector sketch Stock Vector https://www.alamy.com/licenses-and-pricing/?v=1 https://www.alamy.com/charts-bars-and-graphs-icons-sketches-for-business-or-infographic-theme-design-vector-sketch-image402724961.html RF 2EB5KP9 – Charts, bars and graphs icons sketches for business or infographic theme design. Vector sketch Dashboard info data charts, graphs and diagrams for infographics presentation, vector statistics bars. Finance report, business graphic charts and marketing diagrams with percent pies and flowchart Stock Vector https://www.alamy.com/licenses-and-pricing/?v=1 https://www.alamy.com/dashboard-info-data-charts-graphs-and-diagrams-for-infographics-presentation-vector-statistics-bars-finance-report-business-graphic-charts-and-marketing-diagrams-with-percent-pies-and-flowchart-image575635314.html RF 2TCECM2 – Dashboard info data charts, graphs and diagrams for infographics presentation, vector statistics bars. Finance report, business graphic charts and marketing diagrams with percent pies and flowchart Histogram Simple vector icon. Stock Vector https://www.alamy.com/licenses-and-pricing/?v=1 https://www.alamy.com/histogram-simple-vector-icon-image459518620.html RF 2HKGTK8 – Histogram Simple vector icon. Infographic 3D elements. Isometric graphic charts progress bars with people icons for business presentation layout and financial analytic. Vector set Stock Vector https://www.alamy.com/licenses-and-pricing/?v=1 https://www.alamy.com/infographic-3d-elements-isometric-graphic-charts-progress-bars-with-people-icons-for-business-presentation-layout-and-financial-analytic-vector-set-image472343154.html RF 2JCD2EA – Infographic 3D elements. Isometric graphic charts progress bars with people icons for business presentation layout and financial analytic. Vector set Dashboard data charts, graphs and info diagrams, vector infographics element. Presentation charts for finance report and business graphic charts, statistics bars, percent pies and flowchart diagrams Stock Vector https://www.alamy.com/licenses-and-pricing/?v=1 https://www.alamy.com/dashboard-data-charts-graphs-and-info-diagrams-vector-infographics-element-presentation-charts-for-finance-report-and-business-graphic-charts-statistics-bars-percent-pies-and-flowchart-diagrams-image591397250.html RF 2WA4D6A – Dashboard data charts, graphs and info diagrams, vector infographics element. Presentation charts for finance report and business graphic charts, statistics bars, percent pies and flowchart diagrams Dark isometric chart. 3d finance presentation layout with graphs charts diagrams and progress bars of volume figures. Vector business analytic graphic Stock Vector https://www.alamy.com/licenses-and-pricing/?v=1 https://www.alamy.com/dark-isometric-chart-3d-finance-presentation-layout-with-graphs-charts-diagrams-and-progress-bars-of-volume-figures-vector-business-analytic-graphic-image472095422.html RF 2JC1PEP – Dark isometric chart. 3d finance presentation layout with graphs charts diagrams and progress bars of volume figures. Vector business analytic graphic 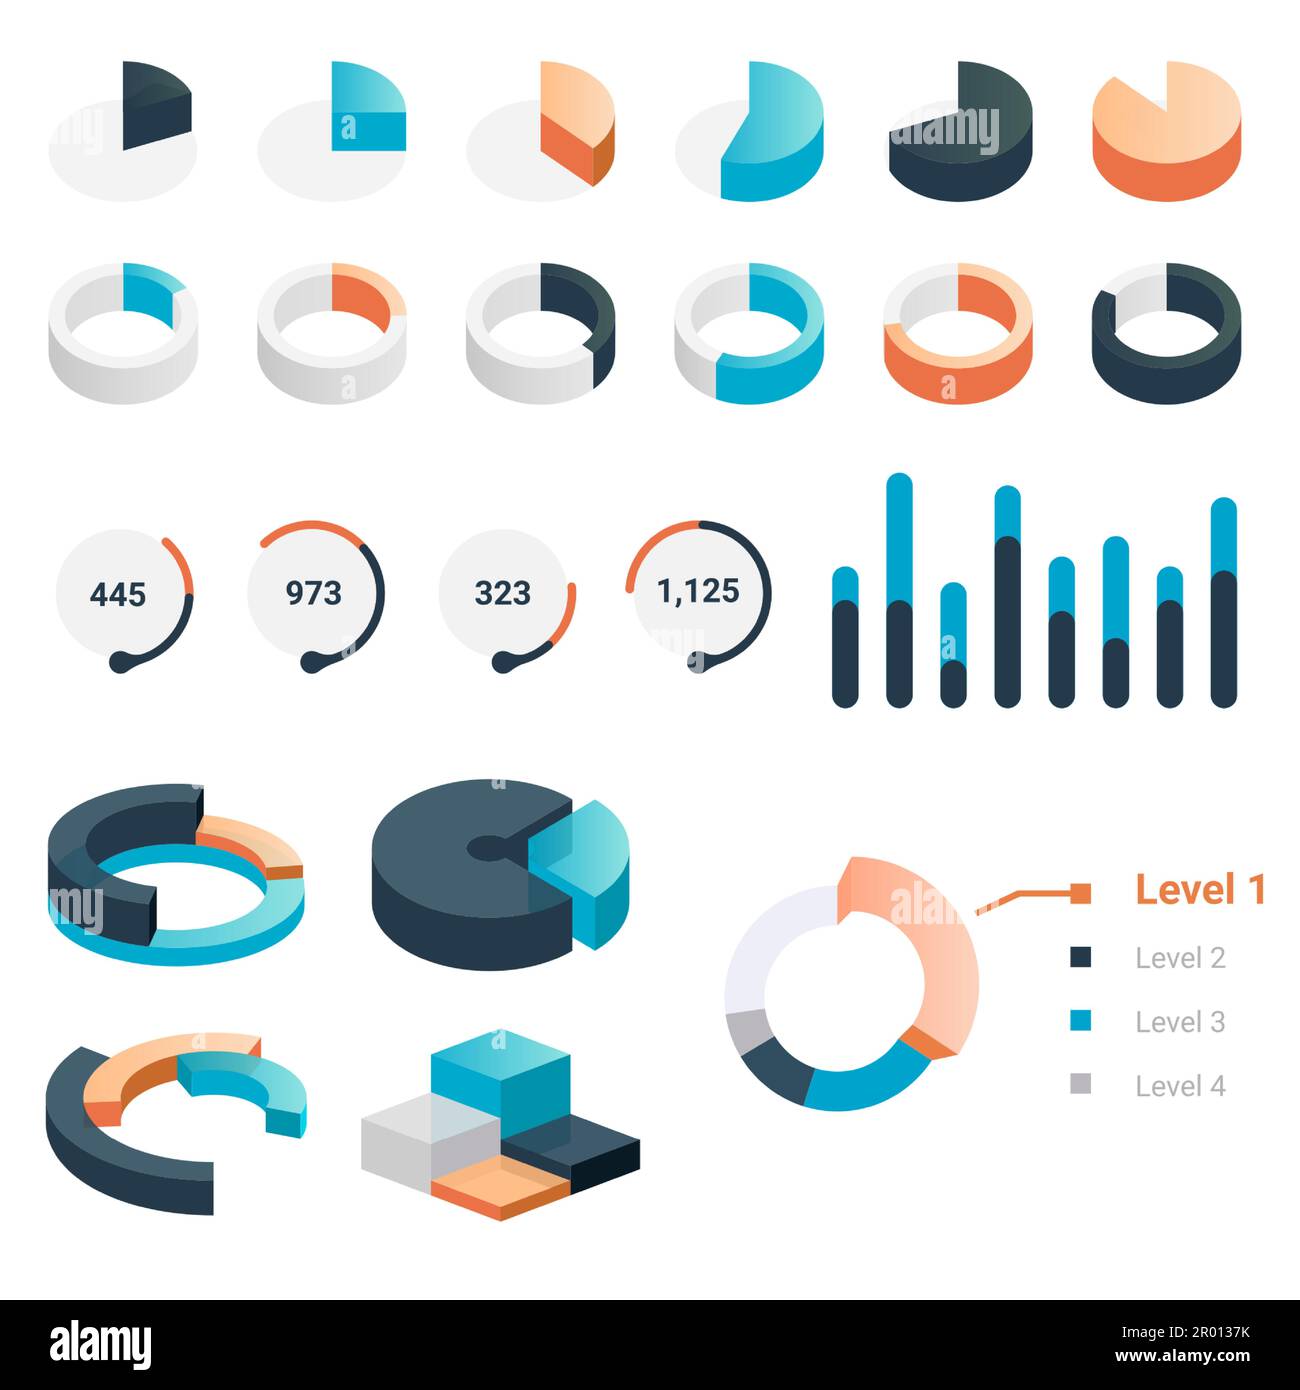