. 244 246 248 250 252 254 256 258 260 262 264 266 268 270 272 Year Day 1997 Figure 22. Time series of wind speed measured at the East Matagorda station Conversely, minimum wind speeds are experienced at approximately 0800 GMT, or 0200 CST. From YD 245 through 250, the maximum wind speeds are associated chiefly with northerly winds (Figure 23). (Wind direction is defined by the standard meteorological convention so that an angle of "0" defines a wind blowing from north to south, and that angles increase in the clockwise direction to a maximum of 360 deg, which again is north) The near
Image details
Contributor:
The Bookworm Collection / Alamy Stock PhotoImage ID:
MCKJDKFile size:
14.3 MB (395.7 KB Compressed download)Releases:
Model - no | Property - noDo I need a release?Dimensions:
3457 x 1446 px | 29.3 x 12.2 cm | 11.5 x 4.8 inches | 300dpiMore information:
This image is a public domain image, which means either that copyright has expired in the image or the copyright holder has waived their copyright. Alamy charges you a fee for access to the high resolution copy of the image.
This image could have imperfections as it’s either historical or reportage.
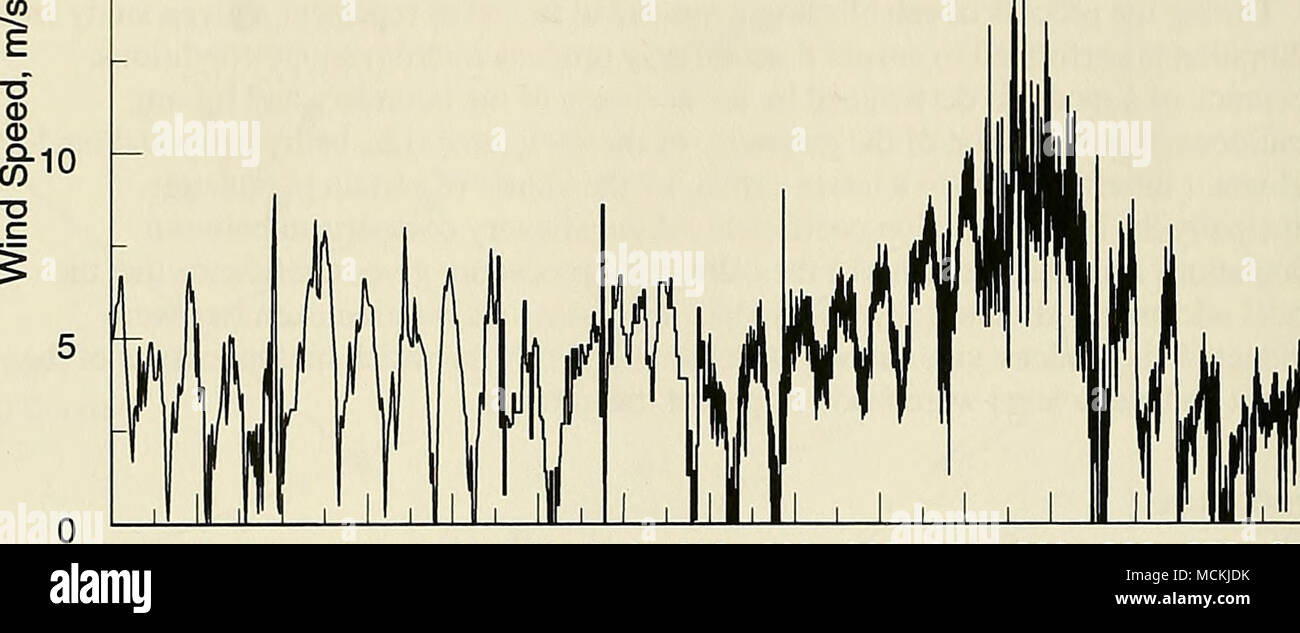
. 244 246 248 250 252 254 256 258 260 262 264 266 268 270 272 Year Day 1997 Figure 22. Time series of wind speed measured at the East Matagorda station Conversely, minimum wind speeds are experienced at approximately 0800 GMT, or 0200 CST. From YD 245 through 250, the maximum wind speeds are associated chiefly with northerly winds (Figure 23). (Wind direction is defined by the standard meteorological convention so that an angle of "0" defines a wind blowing from north to south, and that angles increase in the clockwise direction to a maximum of 360 deg, which again is north) The near-vertical discontinuities seen in this figure result from the wind shifting from the north-northwest to north-northeast (e.g., wind direction from 350 deg to 10 deg) or vice versa. Measured water-surface elevation at the Galveston Pleasure Pier (Figure 24) shows a distinct set down for this period, which should be expected given the east-west orientation of the gulf coastline in the vicinity of the pier, together with the northerly peak daily winds experienced in the region. This same phenomenon was experienced at Lavaca Bay (Figure 25) where the tidal range was reduced to approximately 0.15 m for the period of YD 247 at 1200 GMT to YD 248 at 1200 GMT. (The tidal range is typically about 0.30 m at this station.) For YD 251 through 253, wind direction at the time of peak measured wind speed correspond to an east-southeasterly wind. Water level in Lavaca Bay during this period show a moderate rise with peak maximum and minimum of 0.35 and 0.20 m, respectively. Water level at the Galveston station also appears elevated with a peak water level of 0.45 m. From YD 254 through 261, it appears the tide is the dominating force, as opposed to wind, governing water level in the bay. Water elevation measured over this time span at the Galveston station varied from -0.30 to 0.40 m. The measured water level at he Port Lavaca station varied from -0.02 to 0.40 m. ' All water elevations specifi